Intune Endpoint Analytics digging into startup performance and application reliability
Endpoint Analytics is one of those areas in Intune that is easy to overlook. Most admins will spend more time in devices, apps, configuration profiles, compliance policies and Autopilot. That makes sense, because those are the areas where most of the day-to-day work happens.
But Intune Endpoint Analytics is where you start to see what the user is actually experiencing.
A device can be compliant, encrypted, patched and fully managed, but still be painful to use. Slow sign-ins, poor app stability and high resource usage are all things that generate support tickets, but they are not always obvious from the standard device view.
Endpoint Analytics helps bridge that gap. Microsoft describes it as a way to assess and improve user experience across managed devices, with insights into startup times, app reliability, device performance and battery health. It also supports Intune-managed devices, co-managed devices, Configuration Manager devices through tenant attach, Microsoft Entra joined devices and Microsoft Entra hybrid joined devices.
Never miss an article and subscribe, and don’t forget to check out my YouTube channel, Control Alt Delete Tech Bits
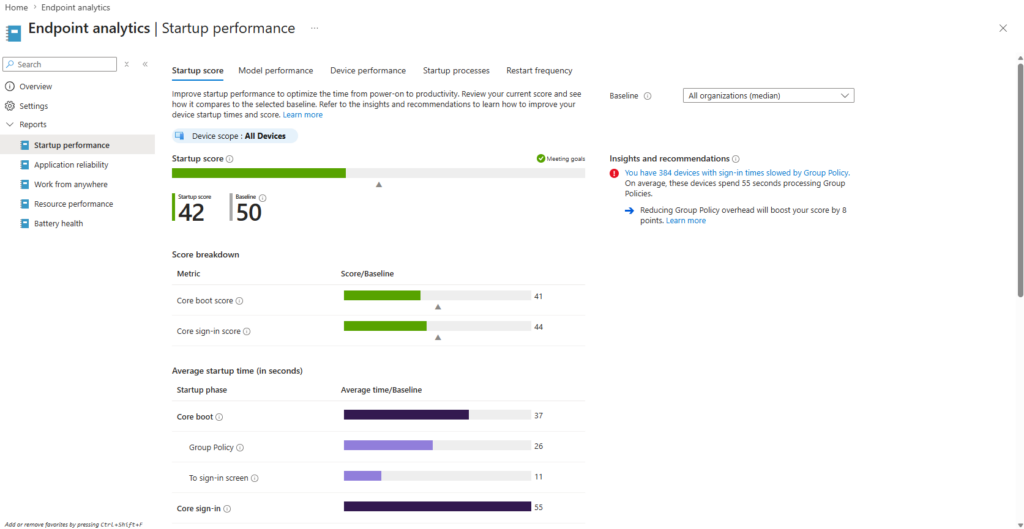
In my example above, the Startup performance report is showing a startup score of 42 against a baseline of 50. That immediately tells me there is room for improvement, but the useful part is not the score by itself. The useful part is the breakdown underneath it.
The report shows the core boot score and core sign-in score separately. That matters because “slow startup” can mean different things. Sometimes the device takes too long to reach the sign-in screen. Other times the device reaches the sign-in screen quickly, but the user waits ages before the desktop becomes usable.
In this example, Endpoint Analytics is also flagging that 384 devices have sign-in times slowed by Group Policy, with an average of 55 seconds spent processing Group Policy. That is the sort of information that is easy to miss if you only look at support tickets. Users normally report “my laptop is slow”, not “Group Policy is delaying my sign-in by nearly a minute”.
Microsoft breaks startup performance into boot and sign-in measurements. Boot covers the time from power-on to sign-in, while sign-in covers the time from entering credentials to reaching a responsive desktop. The startup score is a weighted average of those areas and is scored from 0 to 100.
This is where Endpoint Analytics becomes useful for real troubleshooting. If Group Policy is still doing a lot of work at sign-in, it gives you a reason to review what is still being applied through traditional policy. In a modern Intune-managed environment, that may highlight settings that should be moved into Intune configuration profiles or removed completely if they are no longer needed.

Application reliability is another report that is worth spending time with. In the screenshot above, we can see a list of applications, the number of active devices, the app reliability score, total crashes and mean time to failure.
This is much more useful than waiting for someone to say “OneDrive keeps crashing” or “Excel is unstable”. You can actually see which apps are causing problems across the estate.
In the screenshot, OneDrive.exe stands out straight away. It has a reliability score of 37, 274 active devices, 17 crashes and a mean time to failure of 59 minutes. That would be enough for me to investigate further. By comparison, some other apps show a score of 100 and no crash events, so the issue is not just “all Microsoft apps are unstable”. It points to something more specific.
Microsoft states that the Application reliability report uses data from the past 14 days. The app reliability score is between 0 and 100 and is calculated using mean time to failure and total usage duration. Mean time to failure is calculated by dividing total usage duration by total crashes. Apps with no crash events in the past 14 days show as “No crash events”.
That 14-day window is important. It means the report is recent enough to help with current issues, but it is not trying to represent the entire lifetime of an application. If an app update was pushed last week and crashes started afterwards, this report can help you prove it.
This site and my YouTube channel are supported by Tech-Source.
Tech-Source is a UK-based technology supplier that works closely with IT teams across education, public sector, and commercial environments. They provide hardware, licensing, and infrastructure solutions, with a strong focus on practical advice rather than upselling.
Their support helps keep this site running and allows me to continue publishing in-depth, admin-focused content and walkthroughs without paywalls.
You can find out more about what they do at https://tech-source.co.uk/
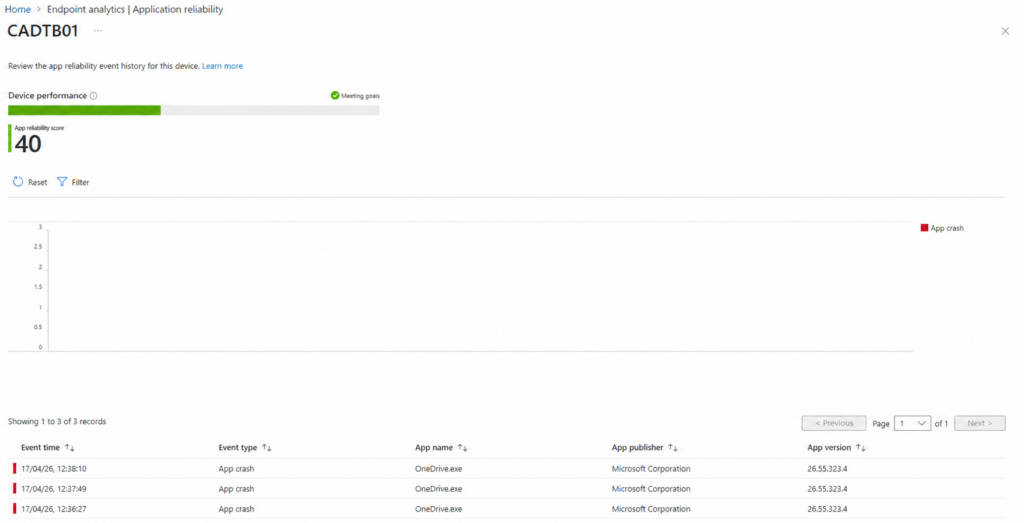
The next screenshot is where this becomes more practical. I have drilled into a device called CADTB01, and the device shows an app reliability score of 40. The event list shows three OneDrive.exe crash events within a short period.
This is exactly the kind of view I would use when troubleshooting a user issue. Instead of relying on Event Viewer on the device, or asking the user to remember what happened, Intune gives you a timeline of reliability events from the portal.
In this case, OneDrive.exe version 26.55.323.4 is shown crashing multiple times. I would now want to check whether the same version is crashing on other devices, whether OneDrive updated recently, and whether there are known issues with the build. If the issue is limited to one machine, I would look at the OneDrive client cache, user profile, sync scope, disk space and any known folder move configuration. If it is happening across many devices, I would treat it as a wider application issue.
Microsoft confirms that selecting a device in the Device performance tab opens the Application reliability view for that device, showing a timeline of app crash and app unresponsive events for a period of up to 14 days
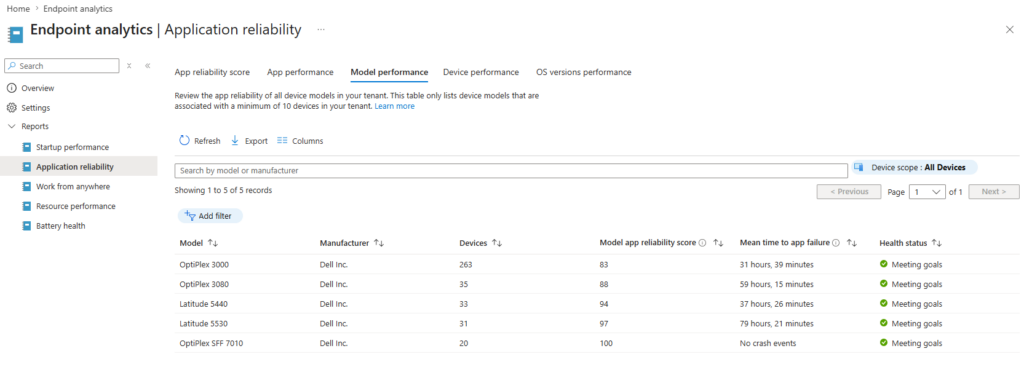
The model performance view is also worth using. In the screenshot above, all listed Dell models are meeting goals, but the scores still vary. The OptiPlex 3000 has a model app reliability score of 83, while the OptiPlex SFF 7010 is showing 100 with no crash events.
That does not automatically mean one model is bad and another is good. You need to consider device count, app usage and what the users actually do on those machines. For example, 263 OptiPlex 3000 devices will naturally give you more data than 20 OptiPlex SFF 7010 devices.
Still, this view is useful when patterns start to appear. If one model consistently performs worse, especially after driver updates, firmware changes or Windows updates, you have a starting point. You can then compare BIOS versions, driver baselines, Windows builds and installed applications.
This is where Endpoint Analytics works well as a starting point rather than the final answer. It tells you where to look.
For me, the best way to use Endpoint Analytics is not to chase every score. Start with the obvious pain points. If Startup performance is showing Group Policy delays, review what still needs to be processed at sign-in. If Application reliability shows OneDrive or Office apps crashing regularly, check whether it is tied to a version, device model or user group. If Resource performance shows heavy CPU or RAM pressure, use that data to support hardware refresh conversations.
The key thing is to use the reports together. Startup performance tells you how quickly users get to a usable desktop. Application reliability tells you whether the apps are stable once they get there. Resource performance and battery health then help fill in the rest of the picture.
Endpoint Analytics will not fix the environment for you, but it gives you evidence. That is the real value.
Without it, you are often working from user complaints, isolated tickets and assumptions. With it, you can start saying things like: “These devices spend nearly a minute processing Group Policy at sign-in”, or “This OneDrive version is crashing repeatedly across multiple devices”.
Endpoint Analytics is one of those features that doesn’t look critical at first, but once you start using it properly, it changes how you approach support and troubleshooting.
Instead of reacting to tickets, you start seeing patterns before they become problems. Instead of guessing why devices feel slow, you can point to actual data. Instead of chasing one-off issues, you can identify what’s affecting large parts of your estate.
The key is not to get distracted by scores or dashboards. Focus on what’s actually impacting users.
If sign-in is slow, find out why.
If apps are crashing, prove it.
If certain devices perform worse, work out what’s different.
Endpoint Analytics won’t fix anything on its own, but it gives you something most environments are missing: evidence.
And once you’ve got that, everything else becomes easier to justify, whether that’s removing legacy Group Policy, fixing app deployments, or pushing for hardware refresh.
You may also like this article about secure boot certificates.
What is Endpoint Analytics in Intune actually used for?
Endpoint Analytics is used to measure and improve the user experience on Windows devices. It collects data on startup performance, application reliability, device performance and more, then surfaces it in reports so you can identify issues and fix them before users complain.
How accurate is Endpoint Analytics data?
The data is generally reliable, but it’s based on telemetry and trends rather than real-time monitoring. Most reports use a rolling window (typically 14 days for application reliability), so it’s best used for identifying patterns rather than diagnosing a single, isolated issue.
What does the Application Reliability score mean?
The score ranges from 0 to 100 and is based on how often an application crashes compared to how much it’s used. A lower score means the app is crashing more frequently relative to usage, while a higher score means it’s stable.
What is Mean Time to Failure?
Mean Time to Failure is the average amount of time a user can use an application before it crashes. It’s calculated by dividing total usage time by the number of crashes over the reporting period.
If you see a low value here, it usually means the app is crashing regularly.
Why does Startup Performance show Group Policy delays?
Even in modern environments, devices can still process Group Policy during sign-in. Endpoint Analytics highlights how much time is spent in that phase.
If you see high values, it usually means:
Legacy policies are still being applied
Policies are doing too much work at sign-in
There’s a mix of traditional AD and modern management
How often does Endpoint Analytics update?
Data is not instant. It’s collected from devices and processed in the cloud, so there’s usually a delay. Most reports reflect recent trends rather than live data.
Can Endpoint Analytics replace traditional troubleshooting?
No, but it makes troubleshooting much easier.
It won’t replace logs, Event Viewer or deep analysis, but it helps you quickly identify where the problem is and whether it’s affecting one device or many.
Does Intune Endpoint Analytics work for all devices?
It works for supported Windows devices that are:
Managed by Intune
Co-managed with Configuration Manager
Connected via tenant attach
Devices also need to be sending telemetry data for it to work properly.
Tags: Intune